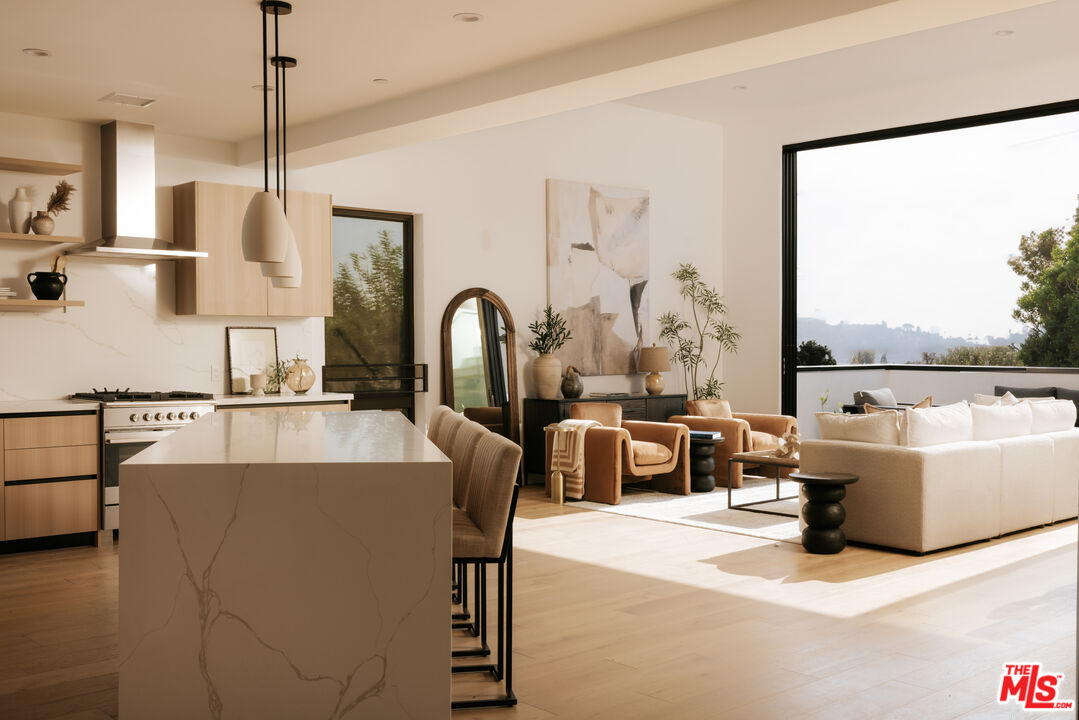
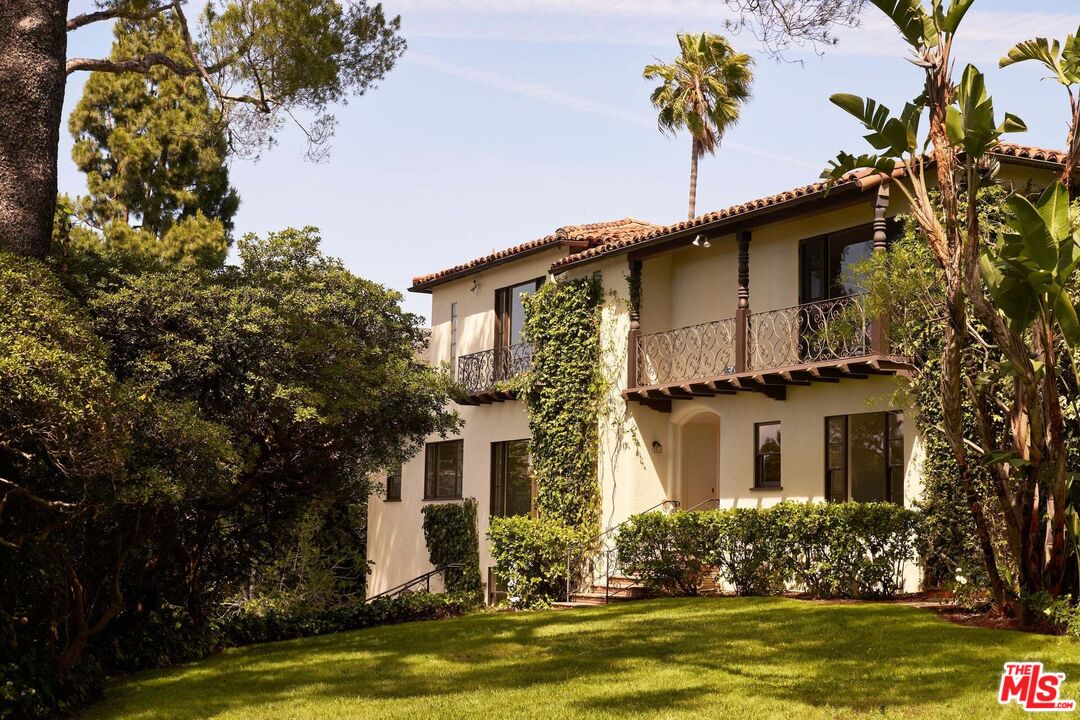
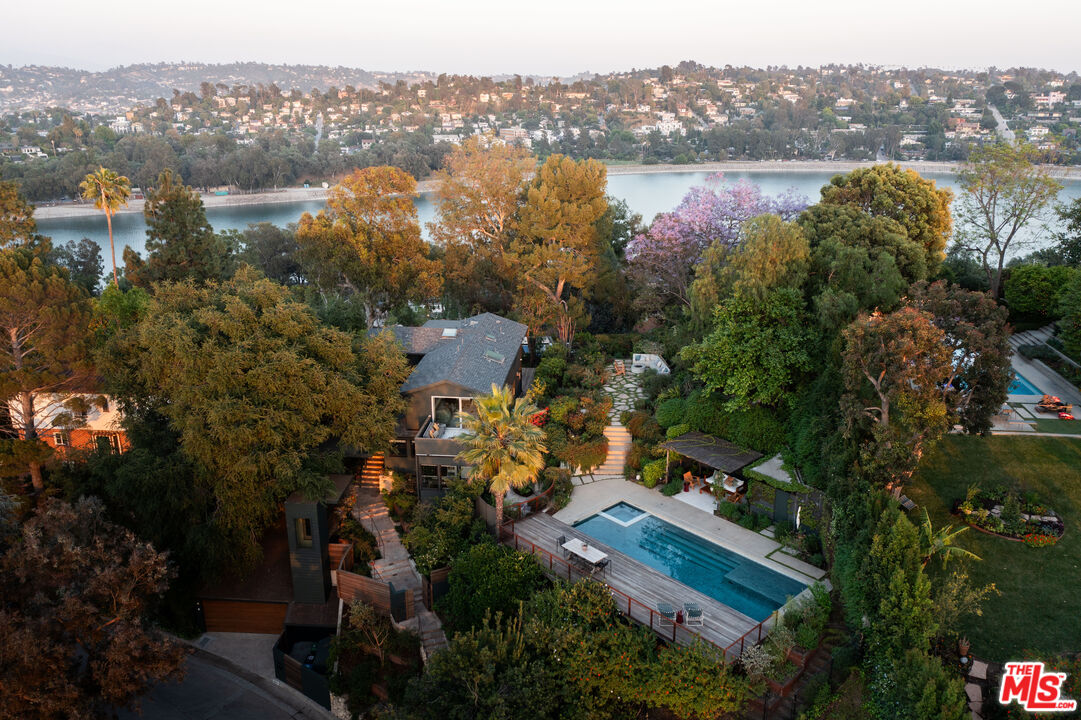
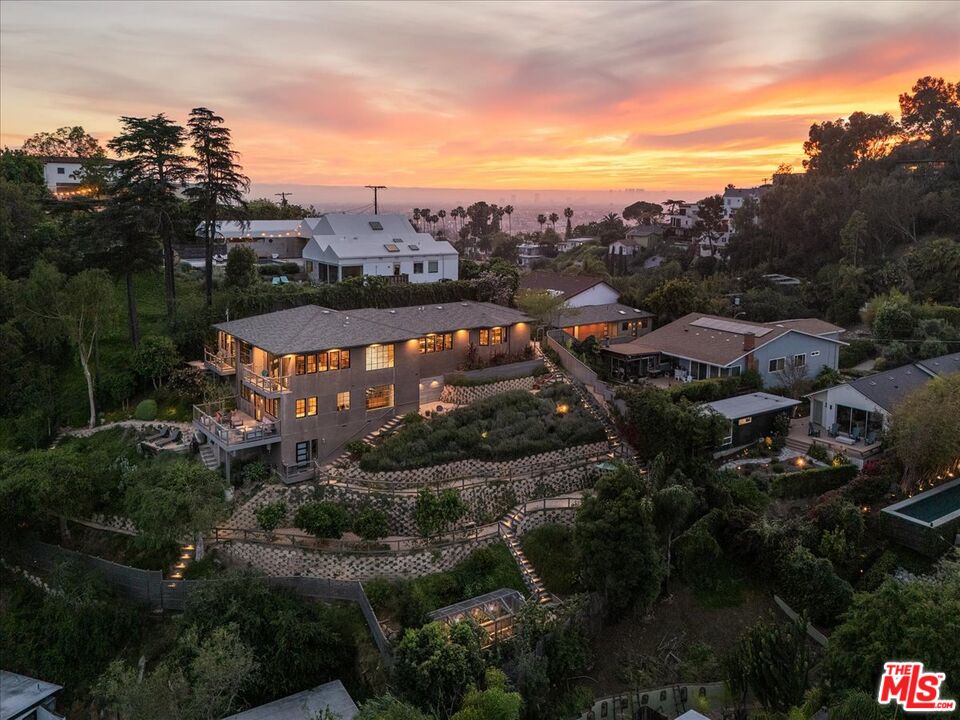
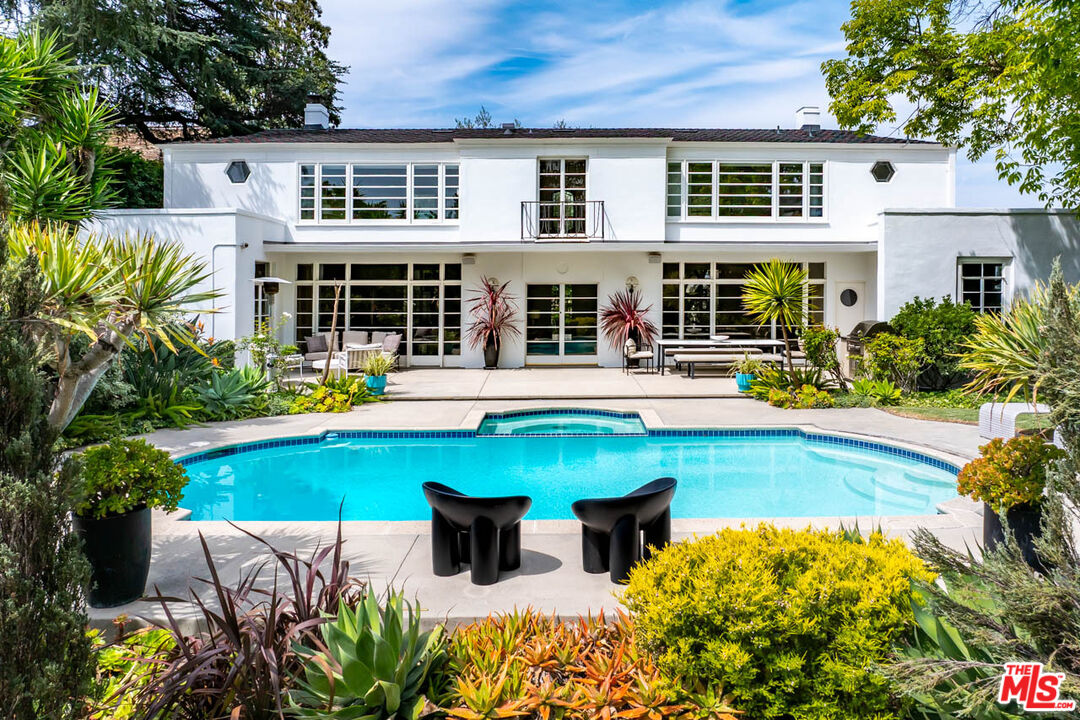
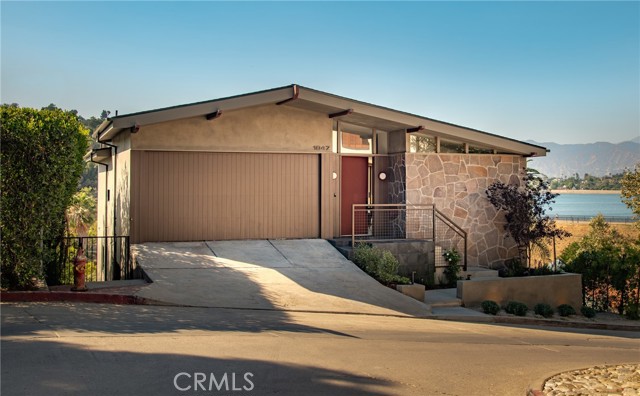
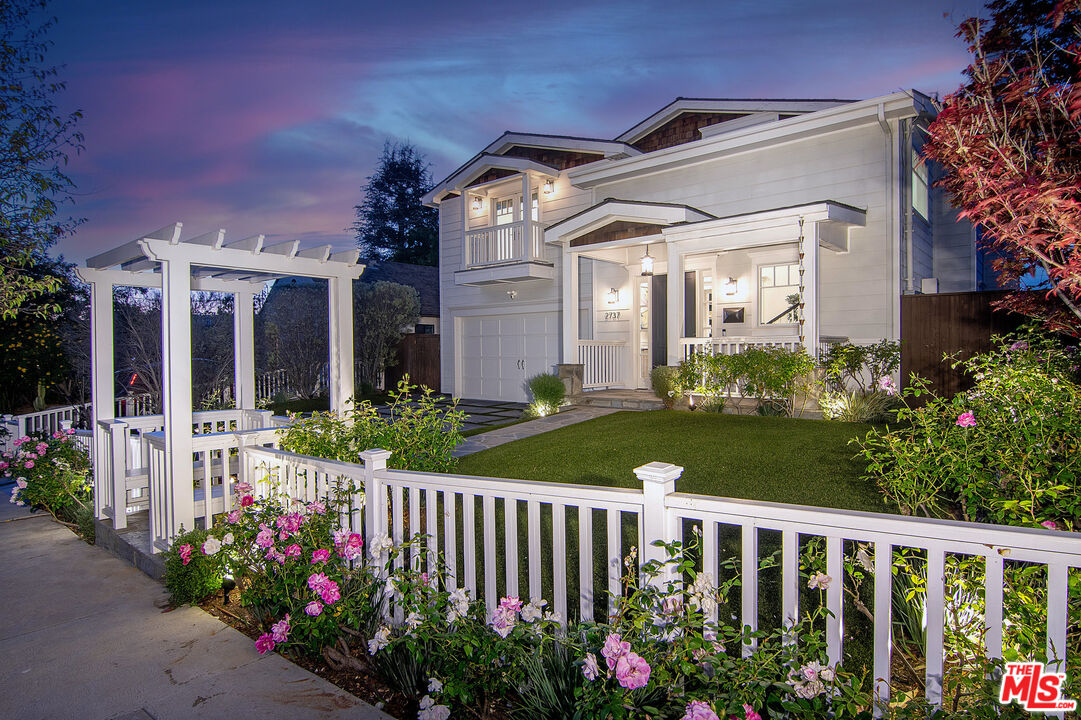
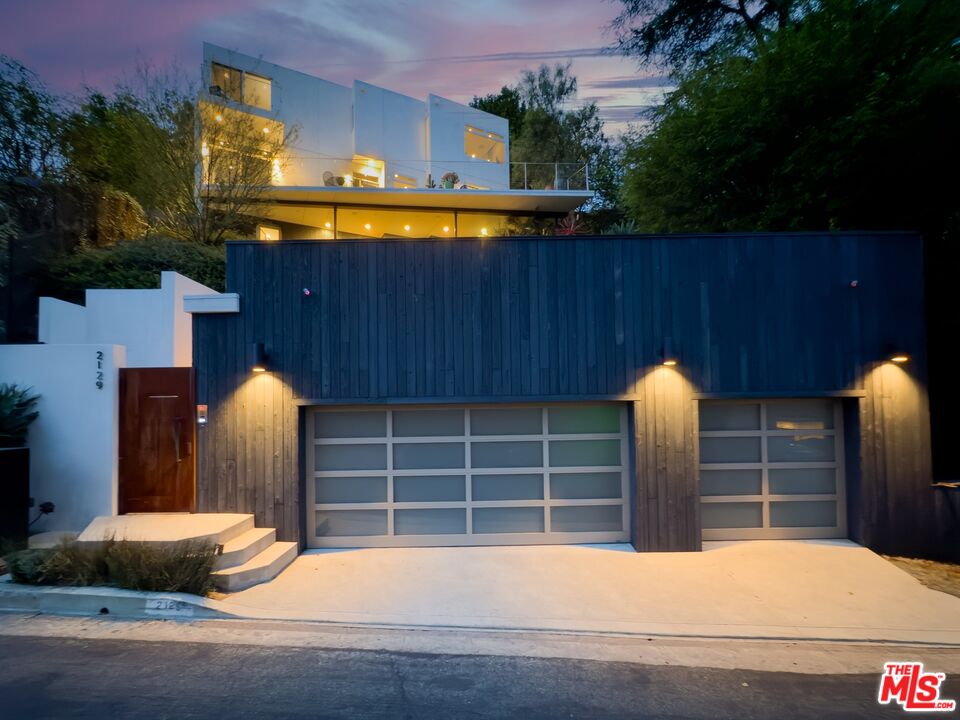
Known for its architectural character and creative energy, Silverlake blends hillside midcentury homes, leafy residential streets, and a vibrant food and design scene. Around the reservoir, modernist icons sit beside bohemian bungalows, creating a neighborhood that feels both cultivated and effortlessly alive.
30,014 people live in Silverlake, where the median age is 40 and the average individual income is $82,740. Data provided by the U.S. Census Bureau.
Total Population
Median Age
Population Density Population Density This is the number of people per square mile in a neighborhood.
Average individual Income
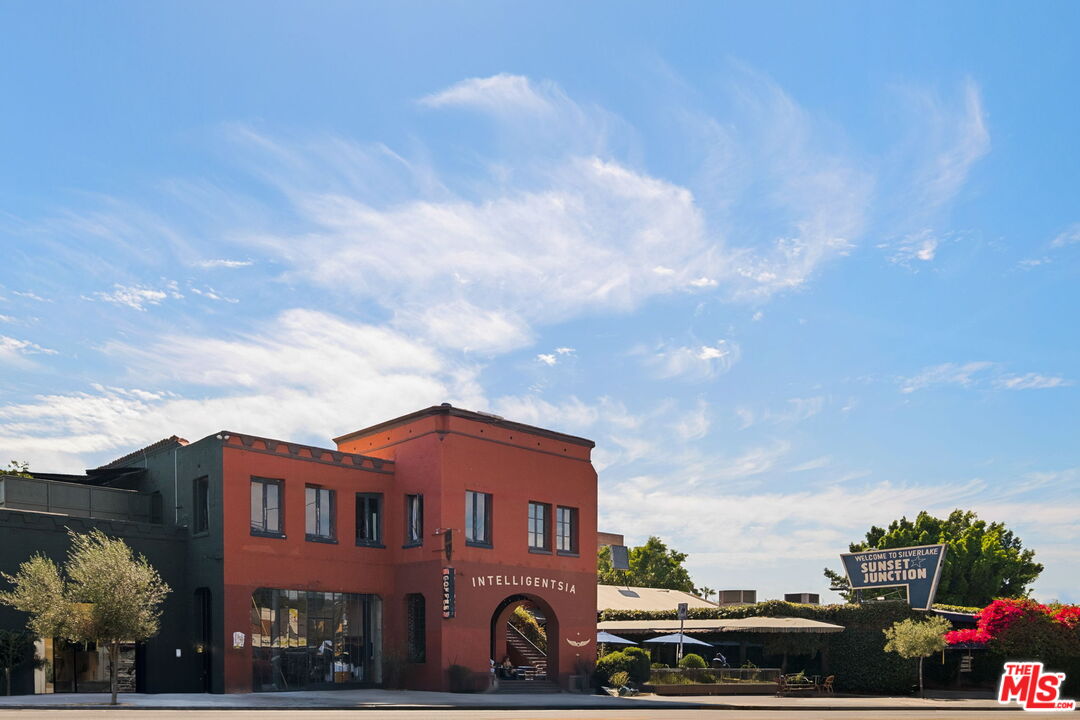
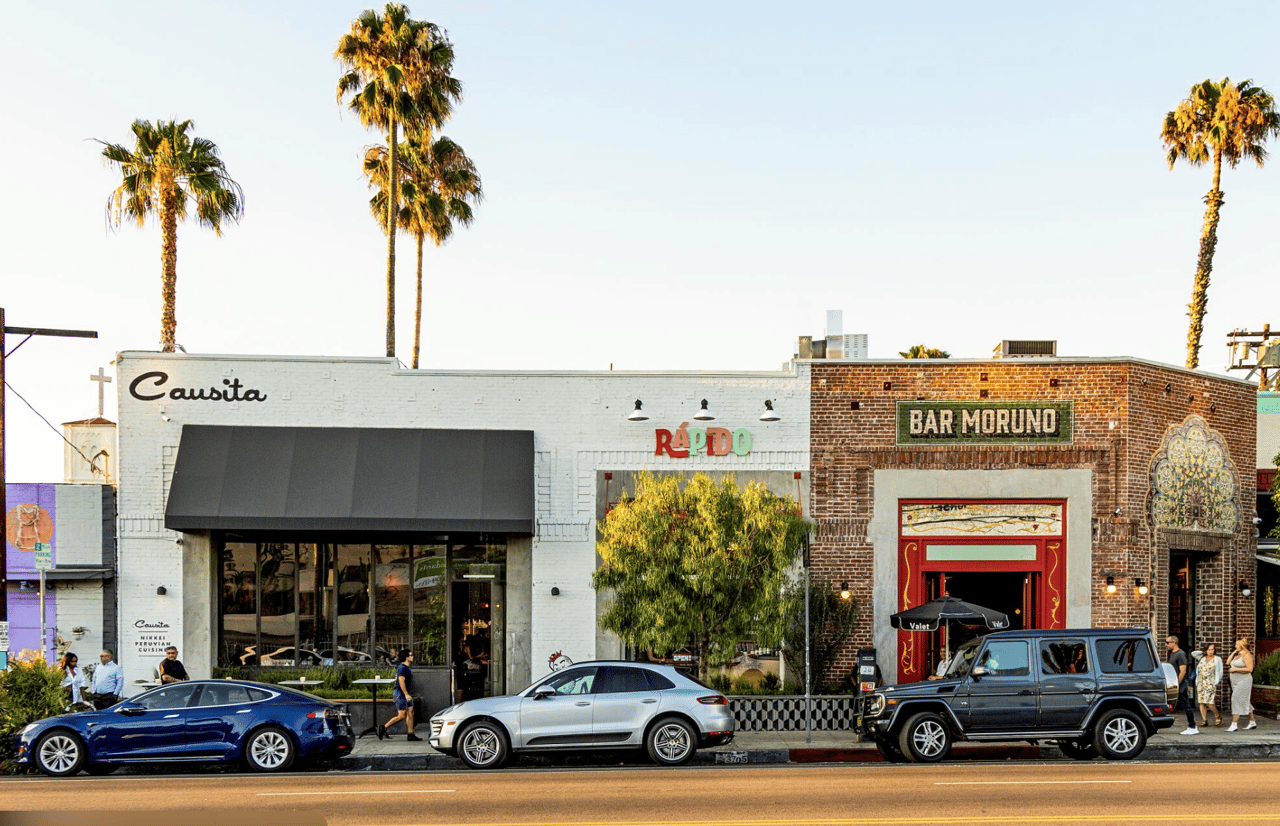
There's plenty to do around Silverlake, including shopping, dining, nightlife, parks, and more. Data provided by Walk Score and Yelp.
Explore popular things to do in the area, including Baking Dankums, Crunly, and Krishna's Pie Cottage.
| Name | Category | Distance | Reviews |
Ratings by
Yelp
|
|---|---|---|---|---|
| Dining | 2.71 miles | 5 reviews | 5/5 stars | |
| Dining | 3.66 miles | 5 reviews | 5/5 stars | |
| Dining | 2.39 miles | 8 reviews | 5/5 stars | |
| Shopping | 3.9 miles | 10 reviews | 5/5 stars | |
| Active | 1.78 miles | 9 reviews | 5/5 stars | |
| Active | 1.45 miles | 12 reviews | 5/5 stars | |
| Active | 3.11 miles | 9 reviews | 5/5 stars | |
| Beauty | 1.18 miles | 5 reviews | 5/5 stars | |
| Beauty | 3.41 miles | 10 reviews | 5/5 stars | |
| Beauty | 3.68 miles | 23 reviews | 5/5 stars | |
| Beauty | 3 miles | 12 reviews | 5/5 stars | |
| Beauty | 3.62 miles | 6 reviews | 5/5 stars | |
| Beauty | 2.68 miles | 16 reviews | 5/5 stars | |
| Beauty | 3.19 miles | 9 reviews | 5/5 stars | |
| Beauty | 3.42 miles | 11 reviews | 5/5 stars | |
| Beauty | 1.25 miles | 8 reviews | 5/5 stars | |
| Beauty | 3.86 miles | 9 reviews | 5/5 stars | |
| Beauty | 1.7 miles | 27 reviews | 5/5 stars | |
| Beauty | 1.18 miles | 11 reviews | 5/5 stars | |
| Beauty | 3.68 miles | 16 reviews | 5/5 stars | |
| Beauty | 1.08 miles | 8 reviews | 5/5 stars | |
| Beauty | 0.79 miles | 10 reviews | 5/5 stars | |
| Beauty | 1.13 miles | 23 reviews | 5/5 stars | |
|
|
||||
|
|
||||
|
|
||||
|
|
||||
|
|
||||
|
|
Silverlake has 14,260 households, with an average household size of 2. Data provided by the U.S. Census Bureau. Here’s what the people living in Silverlake do for work — and how long it takes them to get there. Data provided by the U.S. Census Bureau. 30,014 people call Silverlake home. The population density is 15,363.944 and the largest age group is Data provided by the U.S. Census Bureau.
Total Population
Population Density Population Density This is the number of people per square mile in a neighborhood.
Median Age
Men vs Women
Population by Age Group
0-9 Years
10-17 Years
18-24 Years
25-64 Years
65-74 Years
75+ Years
Education Level
Total Households
Average Household Size
Average individual Income
Households with Children
With Children:
Without Children:
Marital Status
Blue vs White Collar Workers
Blue Collar:
White Collar:
Explore Other Neighborhoods