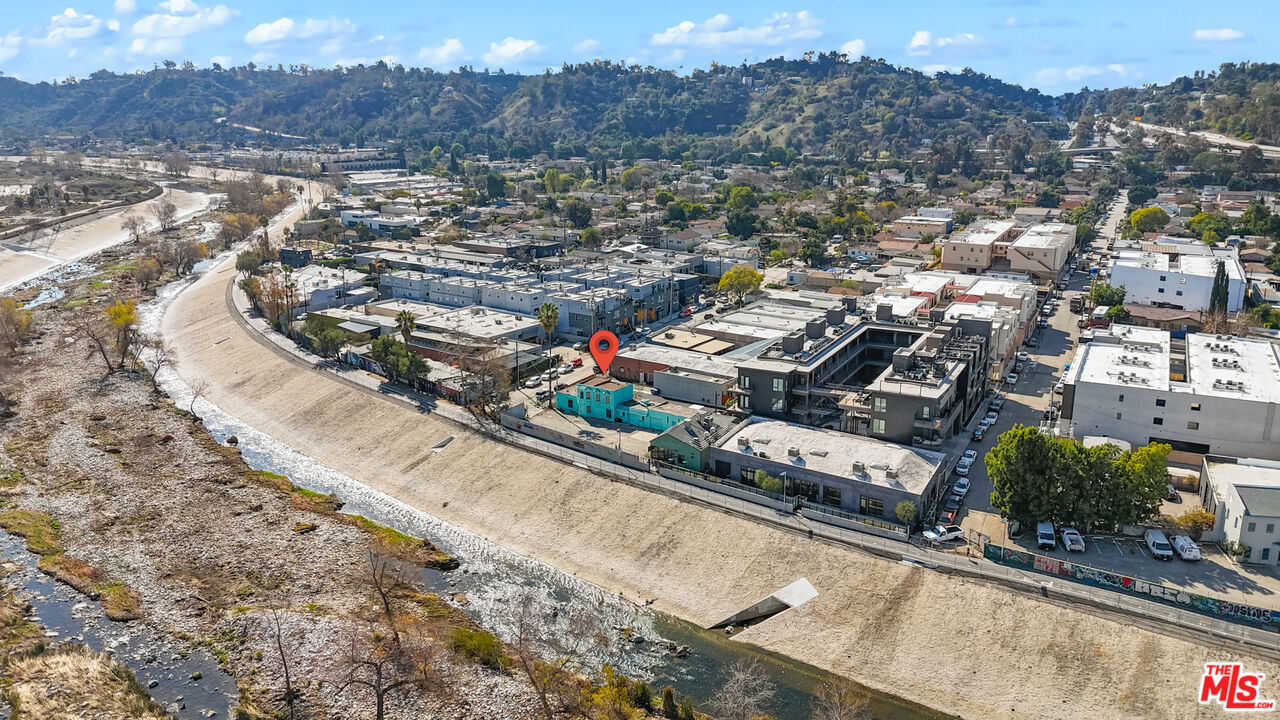
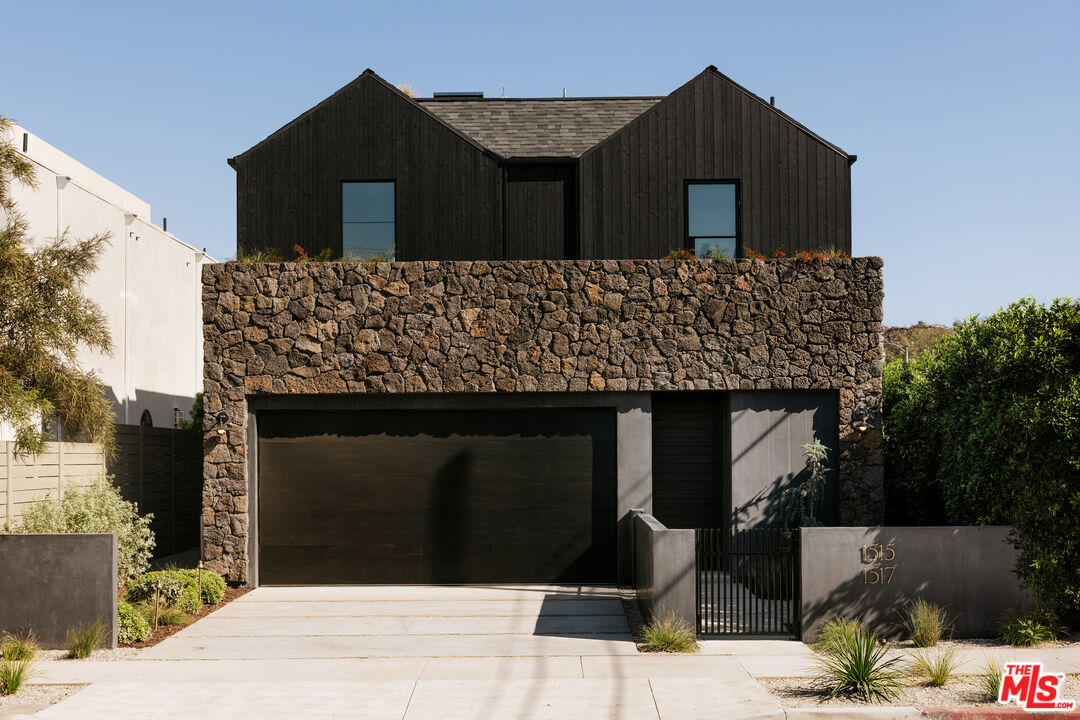
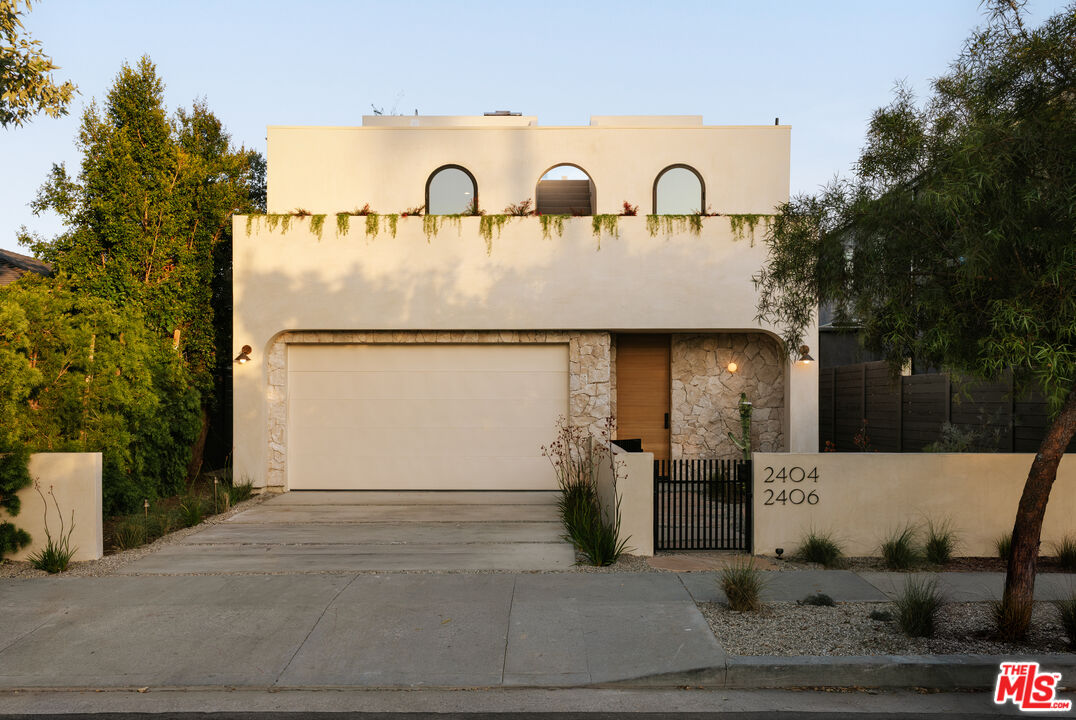
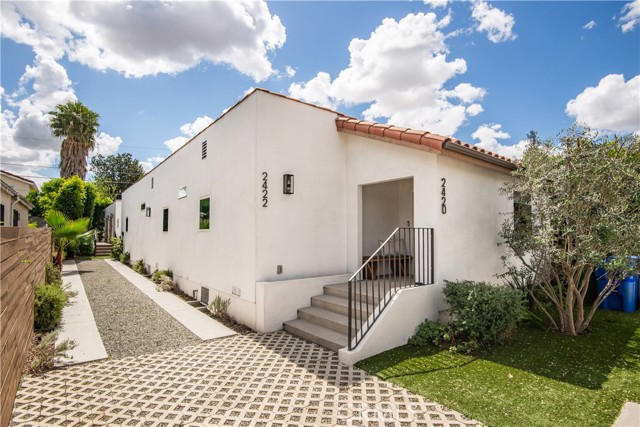
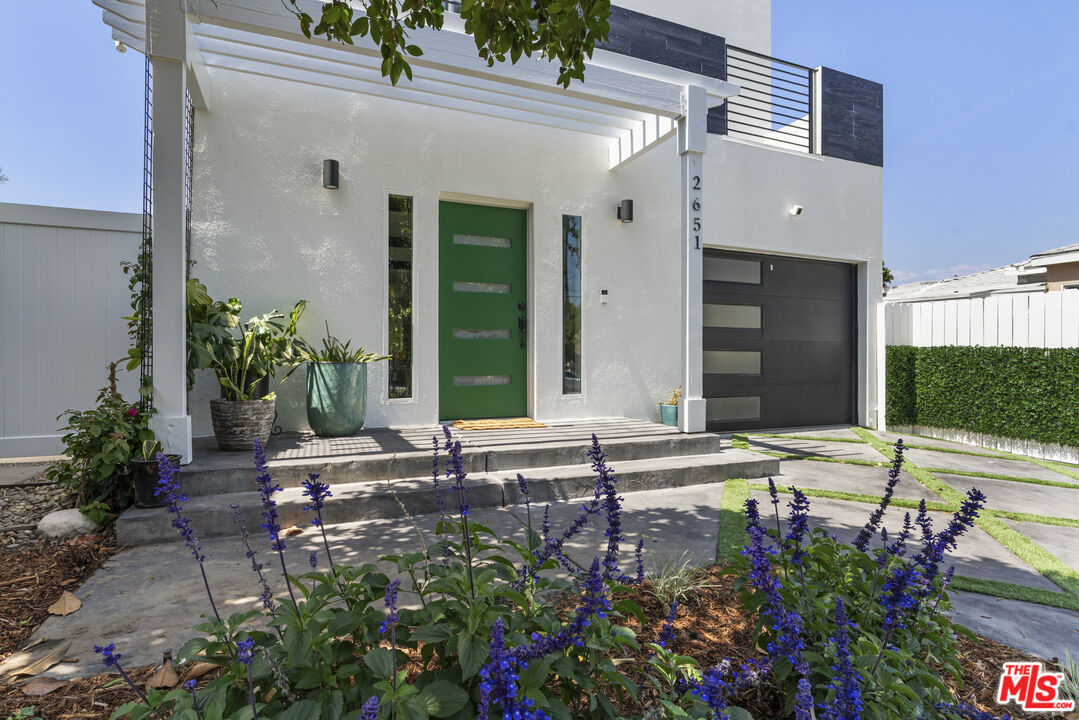
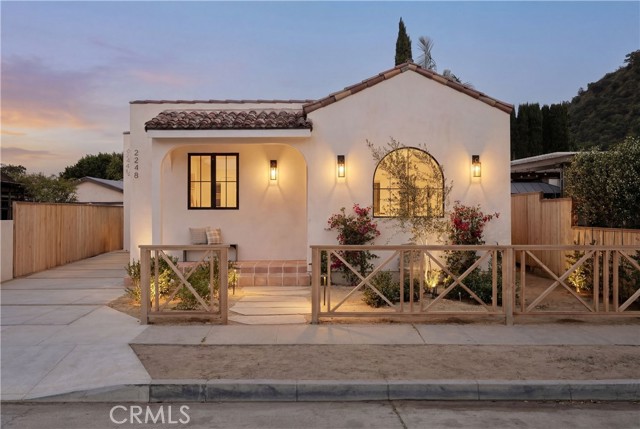
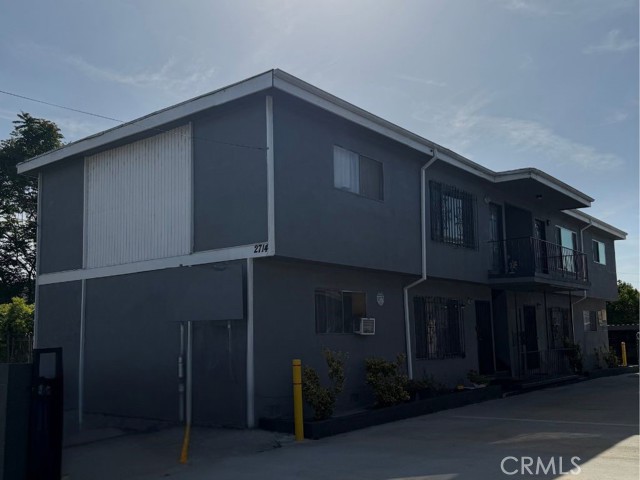
Tucked along the L.A. River, Frogtown is one of Los Angeles’ best-kept secrets—a quietly creative neighborhood where industrial roots meet artistic reinvention. With a growing mix of design studios, riverside cafes, and modernist homes, it’s a pocket of the city where authenticity and imagination thrive.
6,573 people live in Frogtown, where the median age is 40 and the average individual income is $40,835. Data provided by the U.S. Census Bureau.
Total Population
Median Age
Population Density Population Density This is the number of people per square mile in a neighborhood.
Average individual Income
There's plenty to do around Frogtown, including shopping, dining, nightlife, parks, and more. Data provided by Walk Score and Yelp.
Explore popular things to do in the area, including Pizza Daughter, Crunly, and PRIME STACHIOS.
| Name | Category | Distance | Reviews |
Ratings by
Yelp
|
|---|---|---|---|---|
| Dining | 3.1 miles | 17 reviews | 5/5 stars | |
| Dining | 3.56 miles | 5 reviews | 5/5 stars | |
| Dining | 2.93 miles | 6 reviews | 5/5 stars | |
| Active | 1.3 miles | 9 reviews | 5/5 stars | |
| Active | 2.15 miles | 12 reviews | 5/5 stars | |
| Active | 1.57 miles | 17 reviews | 5/5 stars | |
| Beauty | 3.46 miles | 23 reviews | 5/5 stars | |
| Beauty | 3.73 miles | 11 reviews | 5/5 stars | |
| Beauty | 2.03 miles | 12 reviews | 5/5 stars | |
| Beauty | 4.58 miles | 28 reviews | 5/5 stars | |
| Beauty | 3.78 miles | 26 reviews | 5/5 stars | |
| Beauty | 3.86 miles | 16 reviews | 5/5 stars | |
| Beauty | 2.11 miles | 9 reviews | 5/5 stars | |
| Beauty | 1.34 miles | 8 reviews | 5/5 stars | |
| Beauty | 3.19 miles | 9 reviews | 5/5 stars | |
| Beauty | 4.17 miles | 18 reviews | 5/5 stars | |
| Beauty | 2.4 miles | 11 reviews | 5/5 stars | |
| Beauty | 3.68 miles | 5 reviews | 5/5 stars | |
| Beauty | 2.07 miles | 10 reviews | 5/5 stars | |
| Beauty | 2.67 miles | 23 reviews | 5/5 stars | |
| Beauty | 3.61 miles | 11 reviews | 5/5 stars | |
| Beauty | 2.07 miles | 25 reviews | 5/5 stars | |
| Beauty | 2.95 miles | 101 reviews | 5/5 stars | |
|
|
||||
|
|
||||
|
|
||||
|
|
||||
|
|
||||
|
|
Frogtown has 2,242 households, with an average household size of 3. Data provided by the U.S. Census Bureau. Here’s what the people living in Frogtown do for work — and how long it takes them to get there. Data provided by the U.S. Census Bureau. 6,573 people call Frogtown home. The population density is 11,282.778 and the largest age group is Data provided by the U.S. Census Bureau.
Total Population
Population Density Population Density This is the number of people per square mile in a neighborhood.
Median Age
Men vs Women
Population by Age Group
0-9 Years
10-17 Years
18-24 Years
25-64 Years
65-74 Years
75+ Years
Education Level
Total Households
Average Household Size
Average individual Income
Households with Children
With Children:
Without Children:
Marital Status
Blue vs White Collar Workers
Blue Collar:
White Collar:
Explore Other Neighborhoods